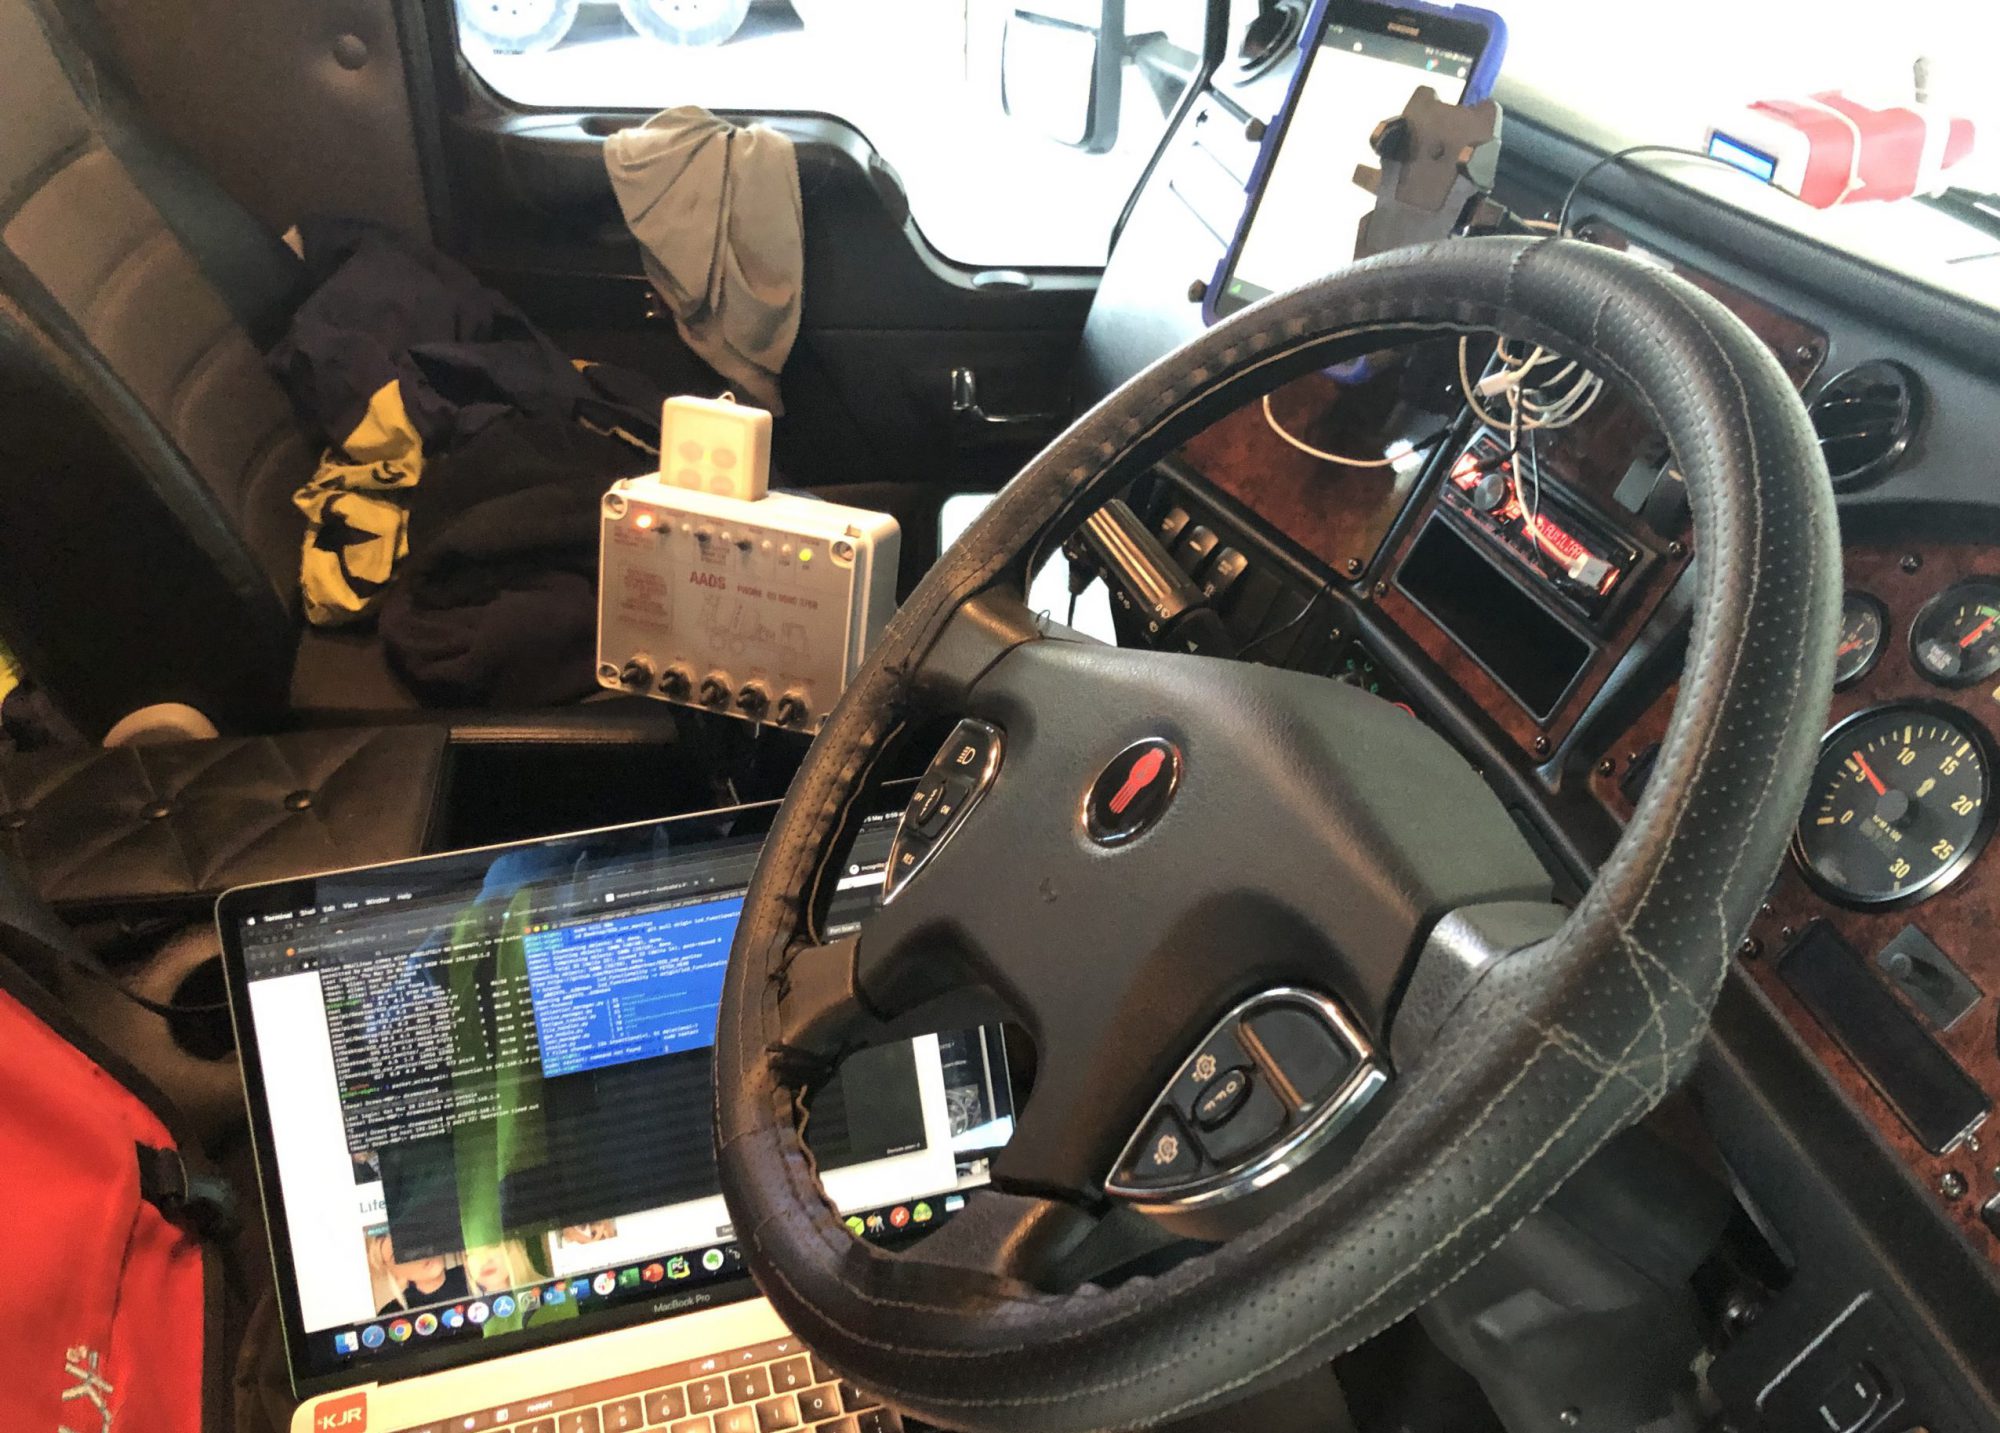
It’s FatigueM8 Friday and to kick off, here’s the photo of the week – sunrise over the Elvin yard this morning.

This week I’m focusing on the heart rate variability; with COVID-19 grabbing a majority of the headlines, there was a couple of articles that got my attention (links at the bottom of this post). There has been a couple of articles published looking at the use of changes in Heart Rate (HR) as an early indicator of a person’s immune system starting to fight an infection. In our observations of heart rate variability (HRV), we’ve seen examples of in baseline HR and HRV as a result of different physiological events and immune responses (not COVID-19 related).
This week we’ll look at two (2) trips too and from Sydney. The first trip we’ll use as the baseline (shown below), we looked at this trip previously with a fatigue lens.

During Trip 1 there was periods of high HRV (Blue & Black lines) and periods with lower HRV (middle of the graph), correlating to increased fatigue being experienced by the driver (which was me!).
The second trip (show below) to Sydney was completed with similar start times (~5am), with the return trip was in the afternoon as compared with the night time return in Trip 1.

If we focus in on the drive to Sydney in the morning, the HRV and HR (Red lines) are similar (as shown below), starting with lower HRV and as the drive progresses the HRV increases. We think this is likely to be connected to the Circadian Rhythm, which we’ll explore in another post. The HR remained pretty constant until right at the end of the trips, which corresponds to hitting North Sydney and having to navigate traffic and find a car park (stressful times for a Canberra driver in the big smoke).
The return drive from Sydney back to Canberra is where we observe some differences in the HRV and HR. It’s import to note the in Trip 1 the driving began at 5:30pm, whereas Trip 2 the driving began at 2:45pm.
We observed in Trip 2 that the HRV and HR is much narrower than was observed in Trip 1. It just so happened on this trip that the driver (me again) suffered a “bout of gout” on the day. I could feel the attack coming on in the morning, just as a tingle, but as the day progressed the attack got worse. The most visible effect of gout (in my case) is a swelling of the big toe on my right foot (which is kind of important when driving). With the swelling comes acute pain and reduced flexibility. The impact on HRV and HR is quite evident when comparing the two Trip’s graphs. What we can see is a sustained period of reduced HRV, combined with an elevated HR, which is the bodies immune response to fighting the Bout of Gout.
Interestingly, in our FatigueM8 trials we’ve observed a similar pattern in response to intense exercise, which we’ll cover this off in the next FatigueM8 Friday!
Stay safe until next Friday.
https://helpwithcovid.com/projects/351-crowdsourcing-resting-heart-rate-to-predict-covid-19-spread
https://www.alivecor.com/press/press_release/new-fda-guidance-allows-use-of-kardiamobile-6l-to-measure-qtc-in-covid-19-patients/

