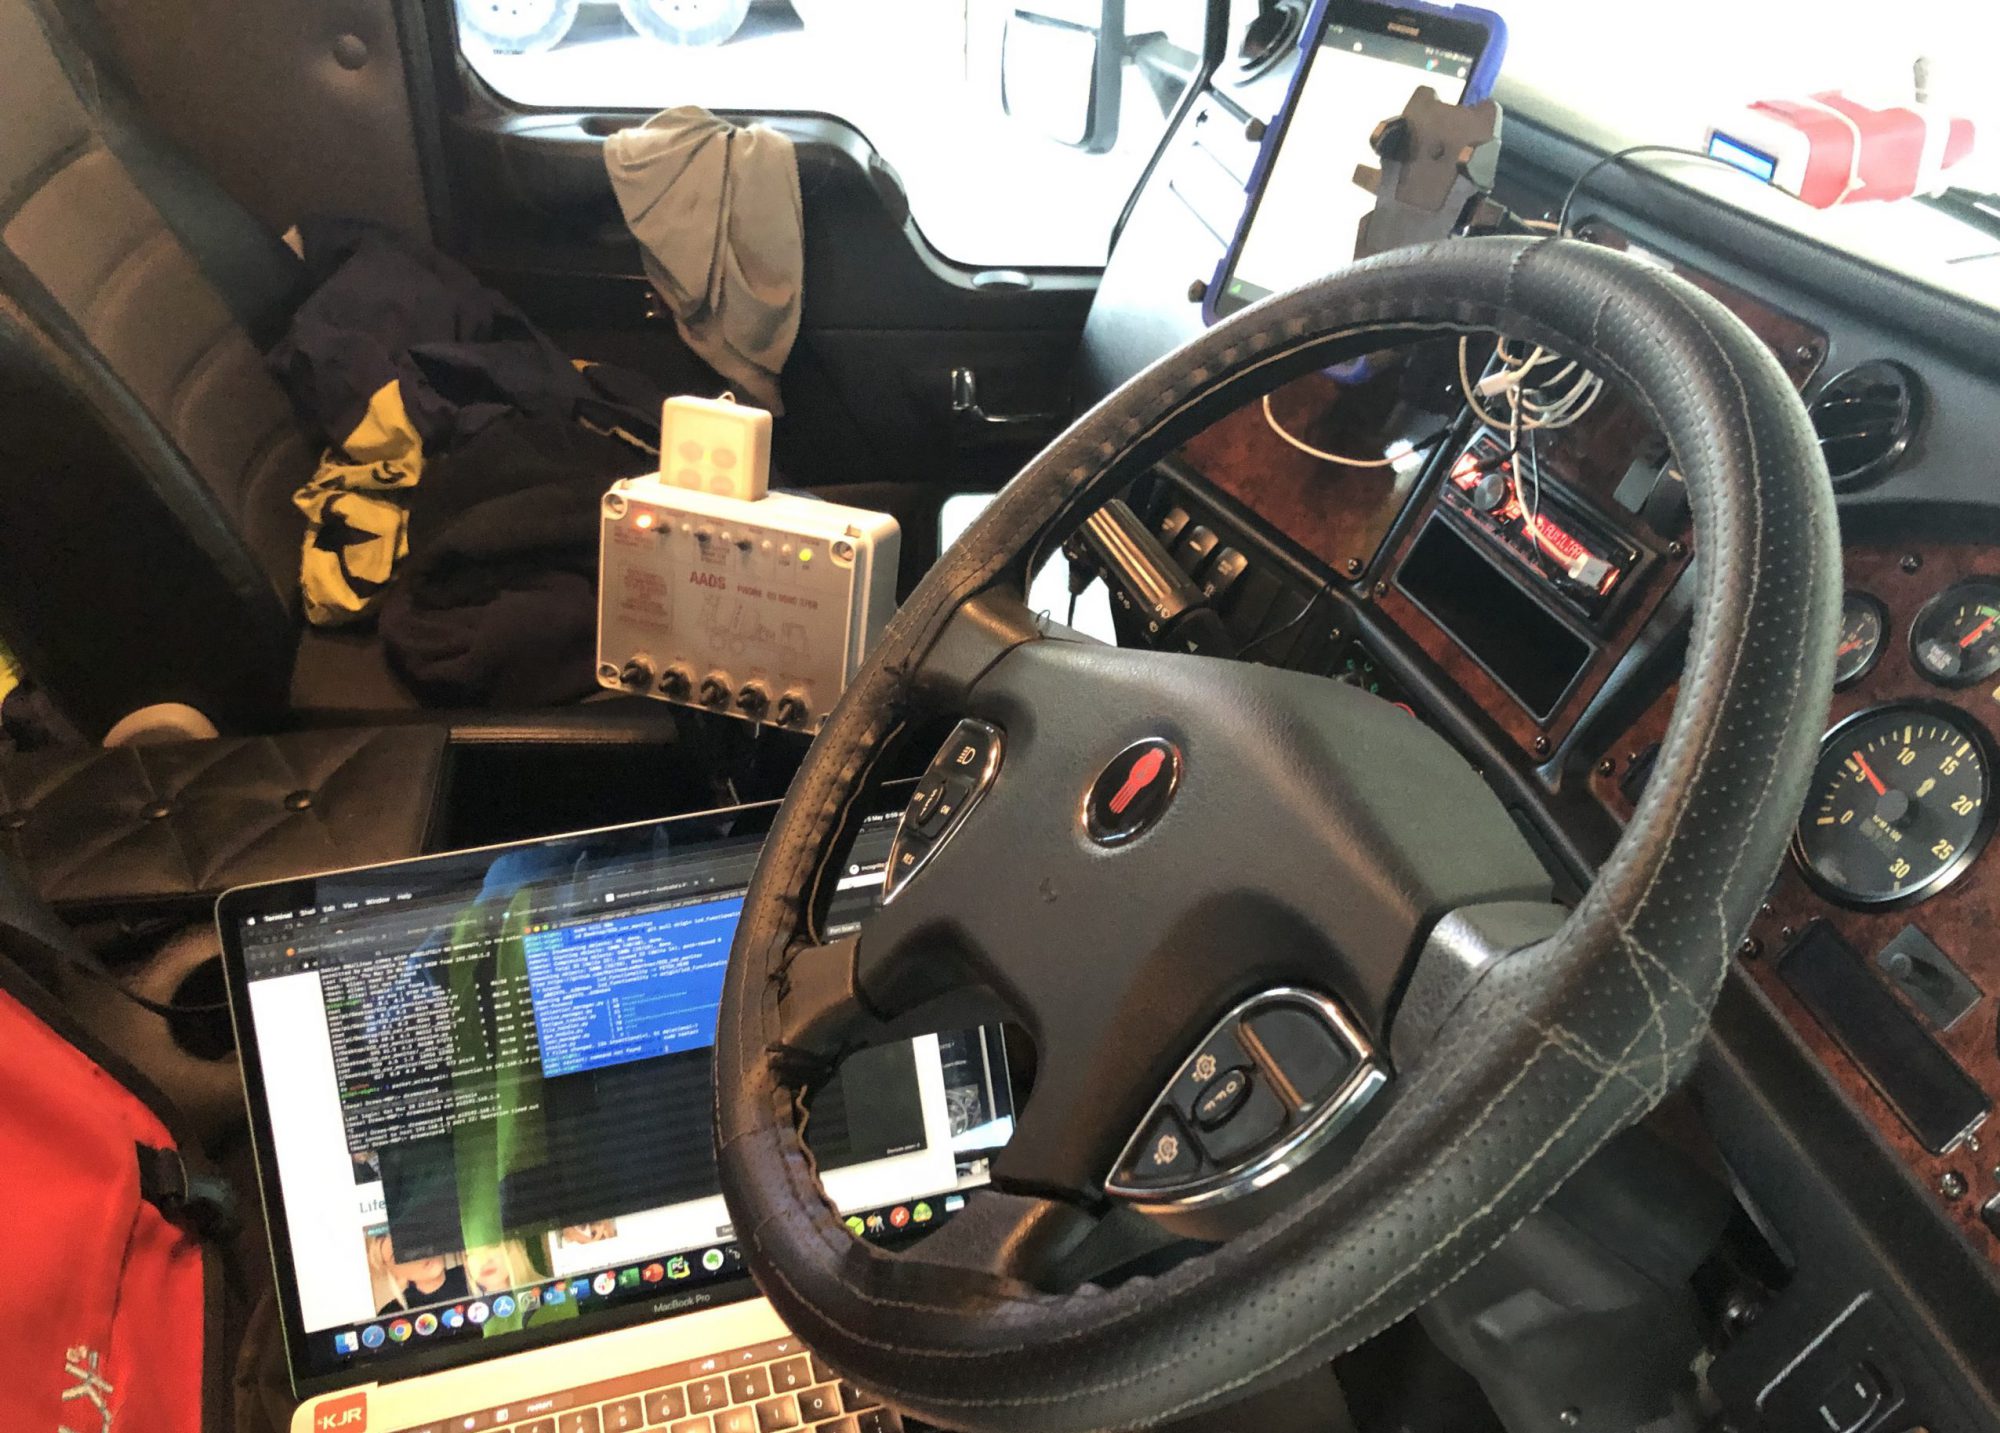
Our FatigueM8 dataset is continually expanding with several vehicles based in Canberra. Each FatigueM8 unit is fitted with a GPS and each of the artefacts we capture (ECG, Steering wheel movement and front facing camera images) or create (ECG Analysis, vehicle Telemetric’s) is geotagged to add extra depth to our analysis. The images displayed (below) plot the on the map the position of the vehicle when the driver had 2-hands on the steering wheel and FatigueM8 was able to capture a valid ECG signal.

fatigueM8 unit 1 & 3 (same vehicle different units) 
FatigueM8 unit2 & 4 (same vehicle different units)
An example of a valid ECG segment captured whilst driving is shown below, along with the heart beat wave form commonly referred too as the QRS Complex.


In the example (above), the R-peak is clearly visible throughout the 10 second sample. The valid sample was collected here (see below) and whilst the car was travelling at 86 kms per hour (in a 90 kms p/hr speed zone). The view out the front of the vehicle was captured, with the traffic conditions being quite light and getting closer to sunset.


Below is an example of an invalid ECG signal, captured just 12 seconds later and as can be clearly seen, there is a mix of R-Peaks, as well as high and low signals. In this 10 second snippet there is not enough R-Peaks identifiable to make any calculations or useful observations in relation to heart rate variation.

The sharp variances up and down correspond to the driver having 2 hands, then 1 hand on the wheel. When we add some more context to the ECG signal from the GPS and front facing camera image, we get more an understanding of what may have happened. One possible scenario would be based on the front facing camera showing the vehicle has changed lanes, which if done correctly would have meant the driver took a hand off the steering wheel to put an indicator on and then switch it off again.


Now back to the pattern. By plotting the location of the valid ECG snippet collections onto the a map (as per the image below), we saw that a high proportion of the samples have been collected on Canberra’s main arterial roads.

We have a couple of hypothesis around why this is the case and we’ll explore them more over the coming weeks.
Until next time, stay safe.

