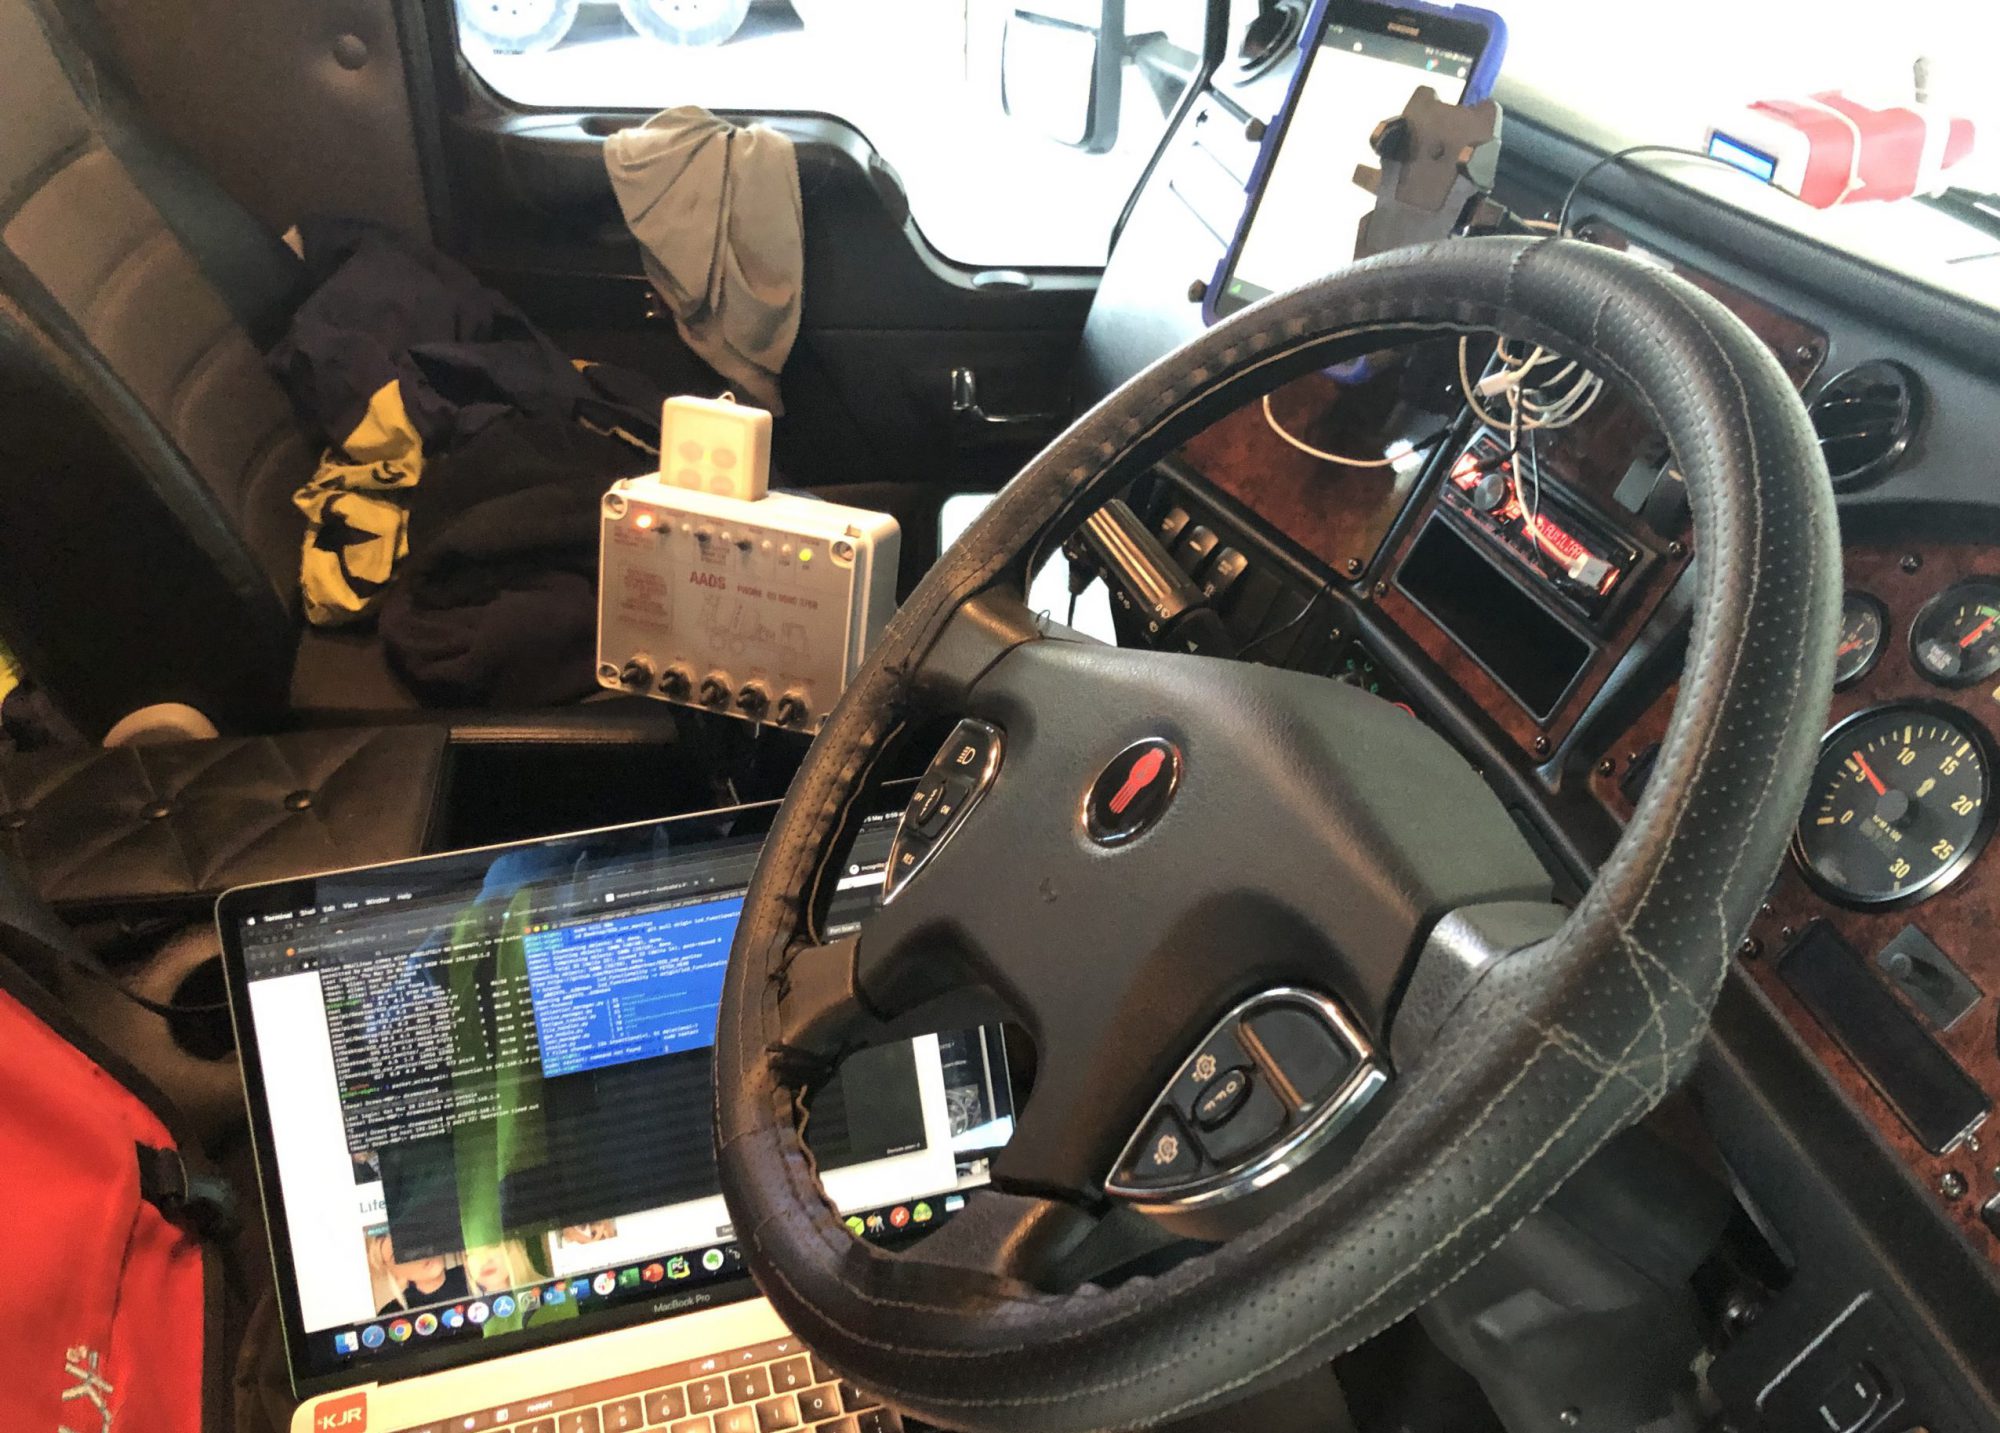
In the Good Friday edition we’re going to explore another of my favourite pastimes Mountain Biking (MTB) and its’ impact on Heart Rate Variability (HRV). Why I hear you ask? well because my “mobile office” is fitted with a FatigueM8 unit and is collecting every time I drive, we’ve observed patterns in my HRV after exercising, so let’s take a look.
In early 2020, escaping the smokey conditions in the Nation’s Capital for a day my mates and I headed for Thredbo for a day of MTB’ing fun.

With my mobile office loaded to the roof, we left Canberra at 5:30am. Making our way down the Monaro Highway, we avoided all of the wildlife on the sides of the road and made it incident free. Our day at Thredbo was epic, covering 85kms, 10 runs down the mountain and 8 hours of activity.

Starting the drive home I was physically tried, but not in a sleepy sense, still on a high from all of the days action. We made it home incident free and safely into bed for a well earned shut eye.
The following afternoon, as is the case after most trips in my car, I started to review the data collected, correlating how I was feeling, the road conditions and any other points of interest. When reviewing the data collected by the FatigueM8 on return that I noticed an interesting pattern in my HRV on this trip.

The trip from Canberra to Thredbo was similar to the other early morning starts, my HR was steady hovering between ~60-65 beats per minute (BPM). The Heart Rate Variation (HRV) was also as expected after having had a solid nights sleep before before starting the journey. The graph (above) show’s the morning’s journey, the blue plot the RR Interval (time between beats), with the black line plotting the moving average (based on the last 20 samples). The red line plots the Heart Rate (HR). Everything was pretty much as expected and similar to my other early morning trips.
Looking at the observations from the return trip, the graph below, it’s clear to see the difference in the HRV pattern.

The return trip is characterised by minimal HRV variance, as can be seen by the relative flat lines of black, blue lines. My heart rate at the beginning of the trip (the left of the graph) was elevated ~ 90 BPM and then reduced through the course of the return trip ~70-75 BPM. Interestingly, the HR didn’t drop back to the resting rate observed on the morning trip, finishing the trip (on the right of the graph) around 80 BPM.
Before reviewing the data, I had expected to see similar patterns to the return trips from Sydney to Canberra, and when it didn’t present in that manner I began to research what the cause was likely to be. Fortunately I came across a paper “Cardiac Autonomic Responses during and Post-exercise Recovery Using Heart Rate Variability and Systolic Time Intervals – A Review 2017” by Michael et al. which was able to provide an explanation to the HRV pattern being presented in the data.
The of Michael et al’s review was to “to summarise: (a) summarise relevant literature relating to cardiac autonomic control during exercise and recovery; (b) present relevant background information on the measurement and interpretation of HRV; (c) examine and summarise the existing literature regarding how key exercise does factors (intensity, duration and modality) influence HRV responses to dynamic “aerobic” exercise, in particular during post-exercise recovery; (d) examine and summarise the existing literature regarding STI responses to exercise and recovery.”
In the paper they explain that HRV is reduced during exercise, as the body responds to the exercise demands, driven largely by the Sympathetic Nervous System (SNS). The SNS controls the bodies “fight or flight” state, ensuring that the HR increases blood flow to the bodies vital organs and muscles, as well as many other physiological responses. After the exercise challenge subsides, “both HR and HRV demonstrate a time-dependent recovery and eventual return to pre-exercise levels” found Stanley et al. 2013. Stanely et al also found that “a higher exercise intensity is associated with a slower recovery of the Parasympathetic Nervous System (PNA)” which was definitely the case post Thedbo, with my HRV and HR taking somewhere between 4 and 12 hours to recover.
In the diagram below is both the whole CBR-Thredbo-CBR trip, plus the next mornings’ data, which shows an elevated HR (~70-75 BPM). Whilst the HRV is greater than the drive home, but still not back to the pre-exercise levels (where the green arrow is).

Based on our earlier observations, there a similar HRV characteristics when comparing the effective of intense exercise and signs of fatigue; both show a reduction of HRV and an increased HR.
The other interesting point to note, is the effect that the intense exercise the previous day had on the HR & HRV characteristics the next morning. At the core of our FatigueM8 solution is a personalised alerting system and as we collect more and more data from different drivers, under difference conditions we’re better able to predict and identify the state of the driver.
Until next week, stay safe.
Paper reference: doi: 10.3389/fphys.2017.00301

