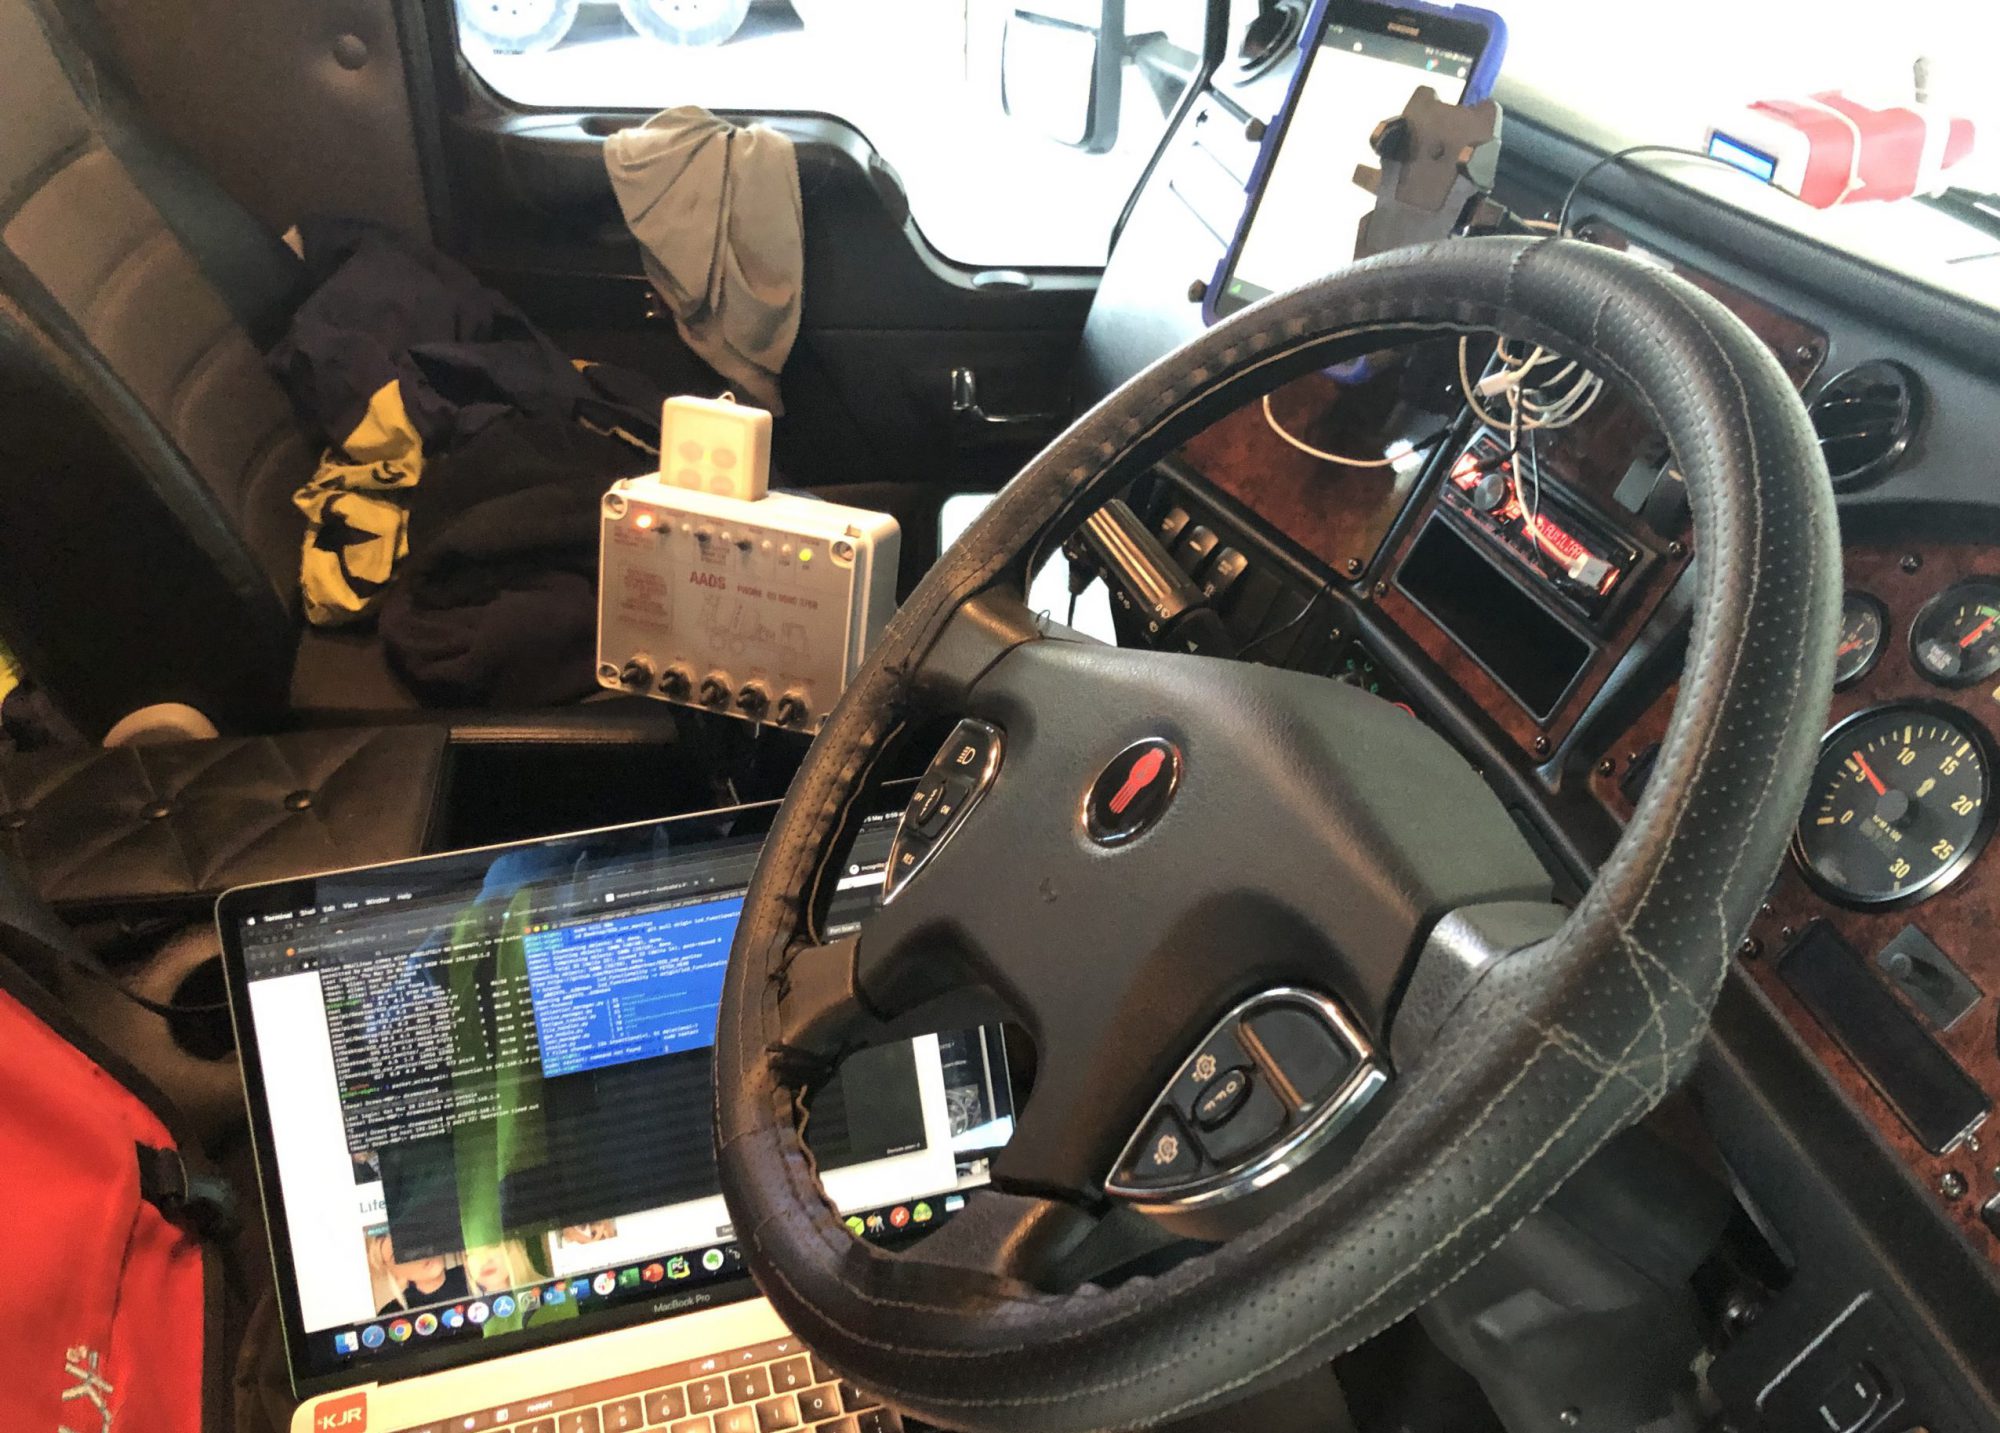
 Recently I was travelling home from Sydney to Canberra, on the eve of my daughters 13th Birthday. I’d left Sydney after a great dinner spent talking to Venture Capitalists, Business-folks, entrepreneurs and people aspiring to change the world. I departed the city just after 9pm hitting the Eastern Distributor, the M5 and finally the Hume Hwy. Traffic was light and the driving conditions were good.
There was loads of big rigs rumbling down the highway and as I do on just about every trip between Sydney and Canberra, Exter is the rest stop of choice. Rolling into a quite Macca’s South bound for a quick coffee recharge;Then back onto the highway to again pass most of the trucks I’d already over-taken earlier in the trip.
Marulan and Goulburn zipped by and I was soon onto the Federal Highway for the last part of the trip. The Federal Highway was a lot quieter than the Hume Hwy and the kilometres past by with ease.
After merging onto the Federal Highway, I had noticed an increasing amount of road kill and was on the lookout for the Australian nocturnal Natives.
Moments later, it happened, movement on the road just up ahead as a Wombat the size of a small horse ambled across the road. He/She shuffled right into my lane and jammed on the brakes and shifted lanes to avoid a collision. I’m not so sure who would of come out of the collision if it happened worse off.
For this trip I’d installed a new FatigueM8 prototype and this trip gave us some great insight into what fatigue looks like. To identify the signs of fatigue, using Heart Rate Variability (HRV), our team has referenced a paper by Chua Et al (https://doi.org/10.5665/sleep.1688) which found that the HRV of people whom are sleep-deprived (fatigued), have a greater and more erratic HRV than those that are well rested (as per their diagram below) +/- 25%

Based on the data captured by our fatigueM8 unit, for the trip from Canberra to Sydney we saw the characteristics observed by Chua et al in their study. When we compare the trip to Sydney (Day) and the return to Canberra (Night) there is a visible difference in the HRV in the graph (the pink lines).

The sharp dip of the red line (Moving average of the pink lines) in the Night graph corresponds to the period where the Wombat ran across the road My heart rate jumped up in response to the wombat wondering across the road, trigging my ‘fight or flight’ my reflex. As the driving conditions returned to normal, my heart rate dropped back to its’ pre-wombat state.
When comparing the day and night time drives, from the perspective of the HRV, it is evident that during the night trip there is an element of consistency within the HRV. The red line in the night graph is relatively flat, with a steady decline across the first period (which corresponds to an increase in HR ~200 on the X-axis). Both before and after the “wombat” (~650 on the X-axis) the HRV is again relatively flat. Our observations, over and above Chua’s reported characteristics, is that when monitored over a longer period of time (> 3hrs in this case), as fatigue increases the HRV decreases. This is caused by the sympathetic nervous system (SNS) wrestling with the para-sympathetic nervous systems (PNS) with the desire for the body to enter a “rest and digest” state.
We’re very much at the beginnings of applying the HRV science to the fatigue use case and against the data we’ve collected. It’s a steep learning curve, but the knowledge we are acquiring and applying will hopefully help to improve fatigue management by making it personalised and predictive for the individual.

